Cricket is undeniably one of the leading sports where game statistics, records, and performance rankings always invite intense arguments. Discussion around who is or has been the best all-rounder in the game has always been a topic of great interest. The terms ‘’batting all-rounder’’ and “bowling all-rounder” have made the qualification and quantification process very subjective.
Perhaps the real challenge is comparing players from different eras, which is not straightforward. Regardless of the rules and assessment criteria, the outcome can vary greatly among statisticians and cricket followers. Very often, assessment can be easily tweaked to elevate any specific player to the top of the ranking or undermine certain players within the ranking system.
Shane Warne bagged over 700 wickets and scored well over 3000 runs. Can we classify him as an all-rounder? No, we cannot categorize him as an all-rounder. Perhaps as a bowling all-rounder but certainly not as a frontline all-rounder. The reason is simple; he accumulated over 3000 runs primarily due to the large number of Tests (145) he played. Shane Warne never had any heroic performance with the bat that changed the game and despite having 3000 runs, he never scored a test century. He was a useful batsman who batted 186 out of 199 innings in Test cricket at batting position 8 or lower with a batting average of around 17.
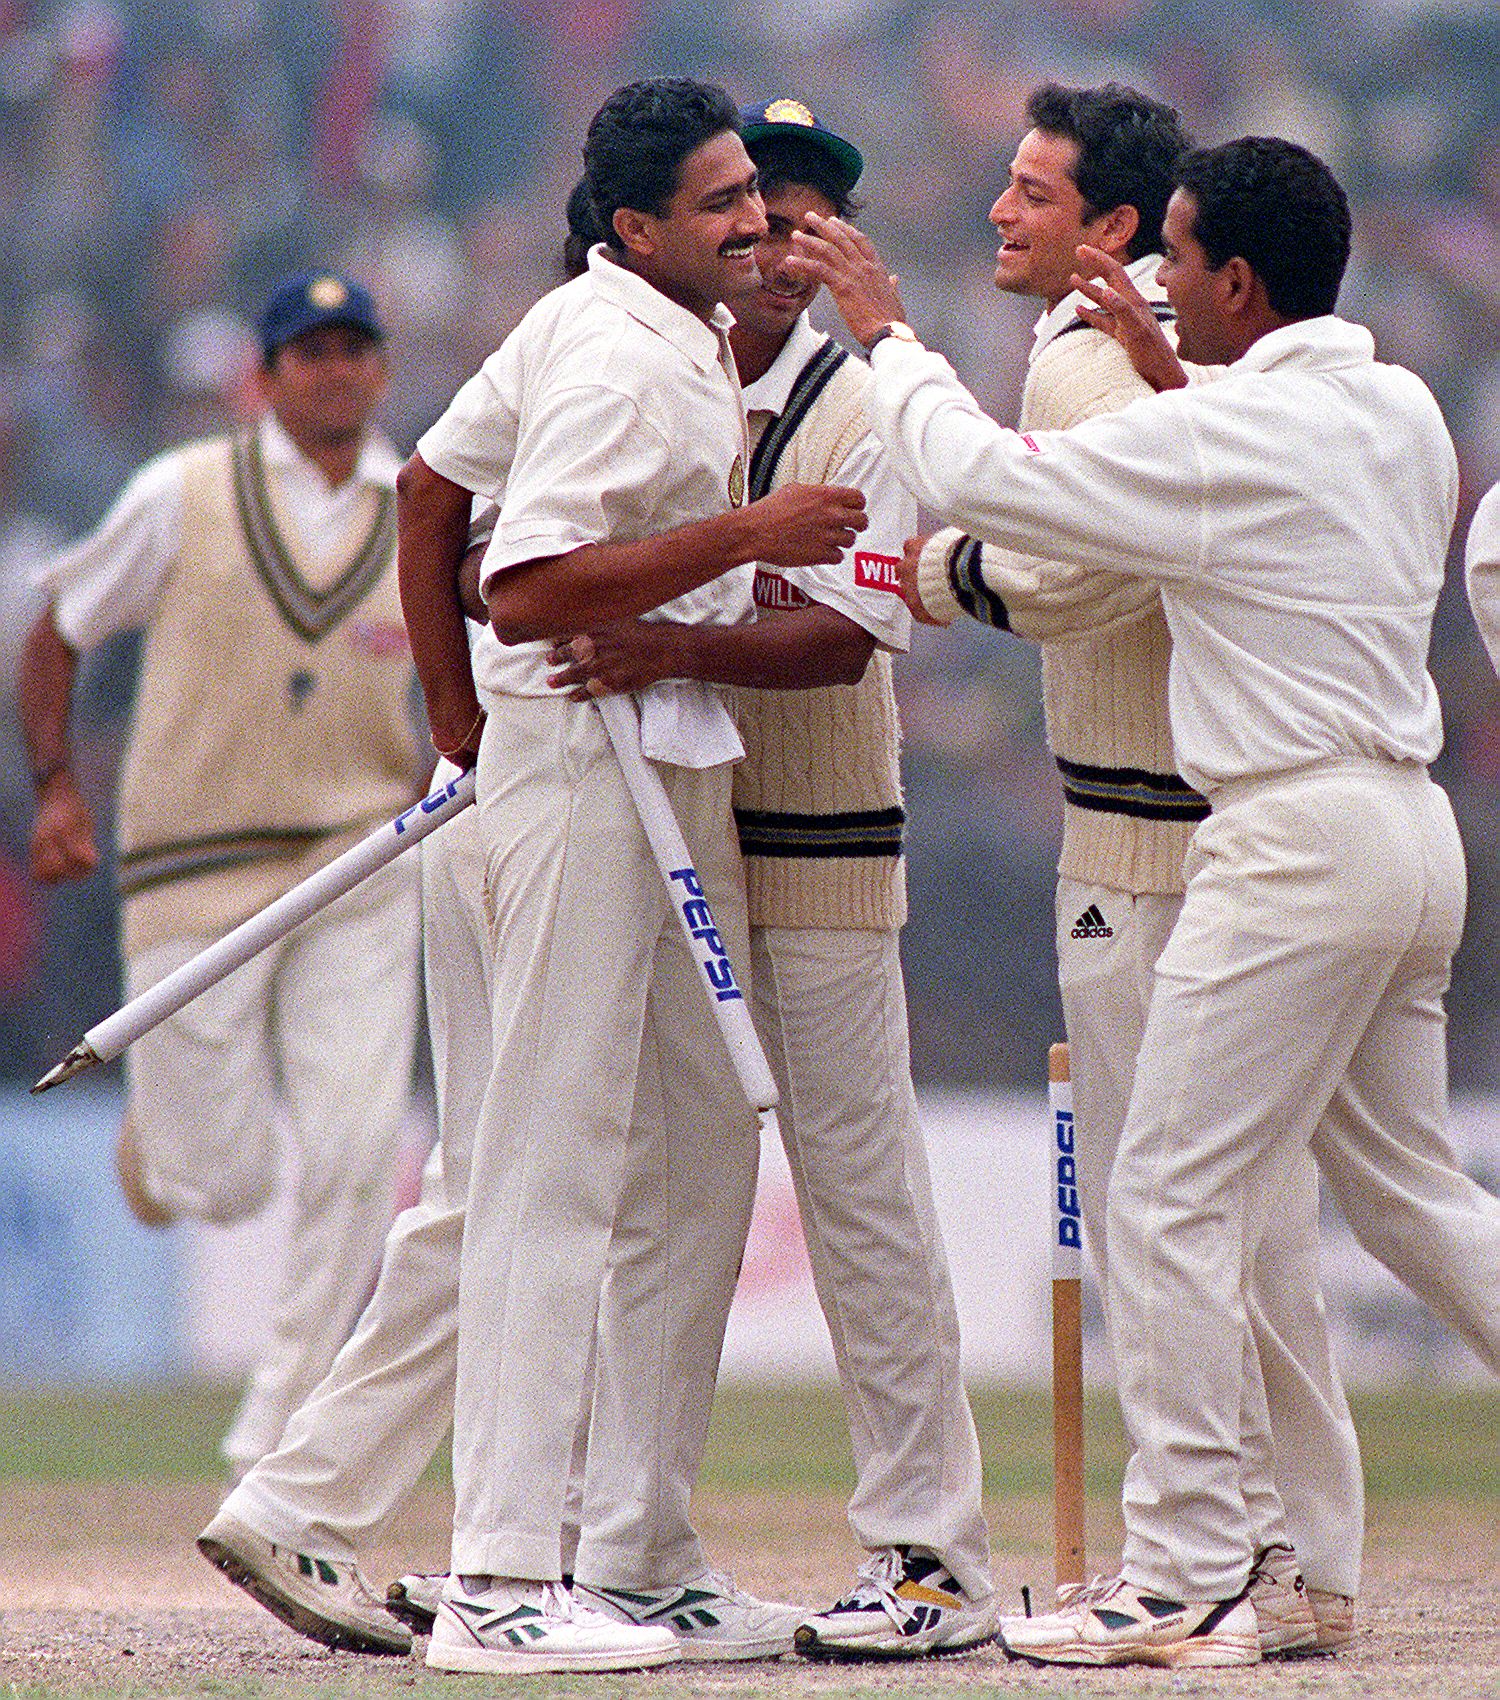
Indian bowler Anil Kumble (L) is congratulated by his teammates after dissmissing Pakistan’s Wasim Akram to win the second test 07 February 1999. Kumble grabbed all 10 wickets in the innings, emulating Jim Laker’s feat against Australia 43 years ago, as India crushed Pakistan by 212 runs. (Photo by – / AFP)
So, who do we call a genuine all-rounder? A genuine all-rounder is expected to excel both in batting and bowling, consistently delivering high-class performances that significantly impact the outcome of games. This player’s contribution with both the bat and the ball should reflect their high degree of skill and versatility through balanced and exceptional performances in both disciplines. Before we go into further quantification process, first we need to pick top all-rounders based on an acceptable qualification criterion. Setting a minimum threshold of 2000 runs and 200 wickets in a test career, there are only 25 players in nearly 150 years of Test cricket who meet these criteria.
This list of 25 all-rounders is quite diverse having players from all major Test playing nations. India and England have five players on this list, four each from Australia and New Zealand, two each from South Africa and Pakistan, and one each from the West Indies, Sri Lanka and Bangladesh.
A glance at Table 1 shows this includes many players who are not genuine all-rounders, but they still accumulated more than 2000 runs primarily due to a large number of matches played. Their average runs per test under 30 is a further revelation of the fact they are useful lower-order batsmen instead of players having good batting prowess, hence it is unfair to call them all-rounders.
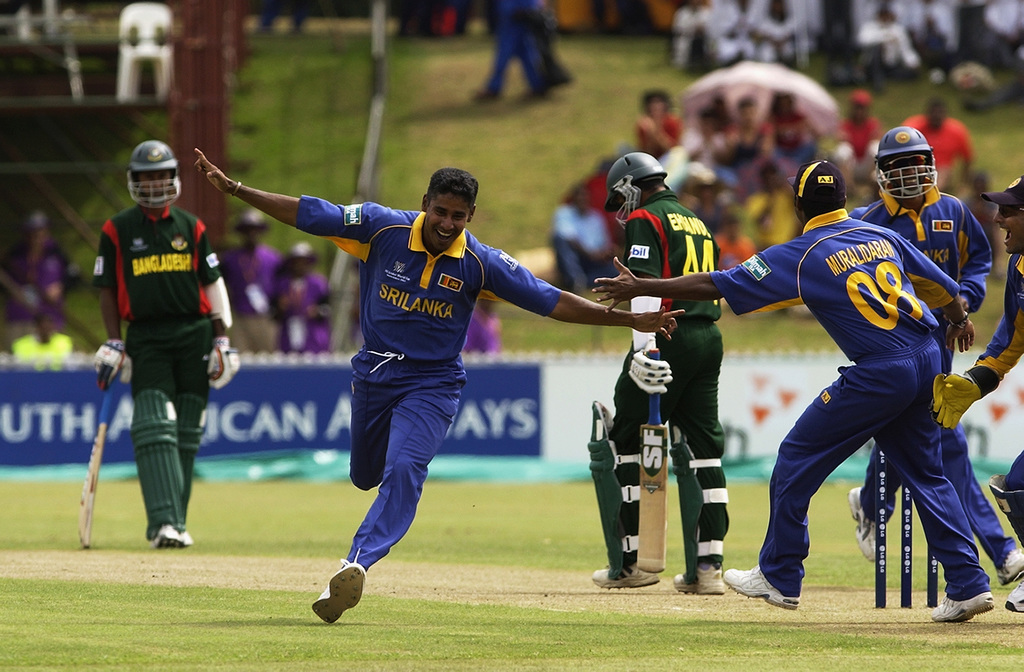
PIETERMARITZBURG- FEBRUARY 14: Chaminda Vaas of Sri Lanka celebrates his hat-trick during the ICC Cricket World Cup 2003 Pool B match between Sri Lanka and Bangladesh held on February 14, 2003 at the Pietermaritzburg Oval, in Pietermaritzburg, South Africa. Sri Lanka won the match by 10 wickets. (Photo by Shaun Botterill/Getty Images)
Table 1: Players with 2000 runs and 200 wickets in Test cricket
Now the challenge is what method is to be used to quantify or rank these all-rounders? The number of runs or wickets is not a true indicator of the greatness of any player or all-rounder as this is largely dependent on the number of matches played by the player. Tendulkar played 200 Tests and scored over 15000 runs whereas Bradman scored nearly 7000 runs in only 52 Tests. Had Bradman played 200 Tests, he would have scored over 25000 runs. This is evident that merely the runs scored, or wickets taken do not reflect the greatness of any all-rounder. We need to look beyond these numbers to find an acceptable methodology for ranking all-rounders.
The most common metric to evaluate the performance of a player with the bat or ball is his batting average and bowling average. To quantify the performance of an all-rounder, it is natural to combine their batting and bowling average which is the most basic approach. However, many other important aspects must not be ignored and somehow need to be taken into consideration while compiling such an index of all-rounders. These additional factors are batting strike rate, bowling strike rate, bowling economy rate, wickets and runs per test. Let us consider these factors and understand why they are important.
Batting & Bowling Average: The most direct measure of any player’s batting and bowling performance is their batting and bowling average. For a top-order batsman, a typical number is over 50 whereas for a decent middle order batsmen should average over 30 in batting. In bowling, a top class high-quality bowlers will have a bowling average under 25 while those averaging between 25 and 32 are also considered very competitive. A bowling average over 32 is deemed somewhat expansive in Test cricket.
Batting Strike Rate: This measures how runs are scored per 100 balls faced. A higher batting SR signifies the batsman’s dominance over the opponents. A typical number between 50 and 60 is considered a decent strike rate in Test cricket. Among the leading batsmen with 5000 runs or more in test cricket, all big names such as Tendulkar, Kohli, Root, Gower, Ponting, Bradman and many others have SR between this range. There are, however, others having much superior strike rates than the normal range which include Viv Richards (69.8), Warner (70.1), Kapil Dev (79.3), Gilchrist (81.9) and Sehwag (82.2). Unfortunately, batting strike rates for players from 1980 and earlier are not available for all the innings hence this matric cannot be used fairly for all players from every era.
Bowling Strike Rate: This measures the number of balls bowled for each wicket taken. It shows the ability of a bowler to take wickets at regular intervals. Looking at all the leading wicket-takers in test cricket, a typical and good number is between 50 and 60 balls per wicket. Leading bowlers with at least 200 wickets falling in this range include Andersson, Ambrose, Roberts, Holding, Lillee, Imran and many others. Among the top wicket-takers, a few bowlers have exceedingly good strike rates such as Rabada (39.2), Steyn (42.3), Waqar (43.5) and Marshall (46.7)
Bowling Economy Rate: This measures the rate at which a bowler is conceding runs. Lower bowling ER shows it is hard to score runs off the bowlers which is a great quality both in Test and limited-over cricket. The typical number is between 2.5 and 3.0. However, some bowlers have ER less than 2.5 – the best among top wicket-takers are Lance Gibbs (1.98), Derek Underwood, Richie Benaud and Bishan Bedi (all 2.10).
Wickets per Test: This metric measures how prolific a bowler is at taking wickets in every Test he plays. The typical number is averaging around 4.5 wickets per Test. Few bowlers (among those who have at least 200 wickets) have taken more than 5 wickets per test include Muralitharan (6.02), Grimmett (5.84), Ashwin (5.6), Yasir Shah (5.08), Lillee (5.07) and Hadlee (5.01).
Considering all these factors, numerous ways exist to create a comprehensive mathematical model. One of the possible or perhaps simpler approaches is to establish composite batting and bowling scores:
Batting Score = Batting Average
Since batting strike rate data for all players is not available, a more direct measure for batting score is the batting average. A higher value indicates a better batting performance.
Bowling Score = (Bowling Strike Rate / Wicket per Test) + Bowling Average
A lower bowling strike rate and a higher wickets per test are always a better proposition for any bowler. The quotient of these two numbers added to the bowling average will give bowling points. Bowlers with lower bowling averages are always considered better. The lower bowling score reflects better bowling performance. Let’s take the example of Kallis and Harbhajan Sing. Kallis SR is 69.3 and W/T is 1.76 whereas Harbhajan SR is 68.5 and W/T is 4.05. A superior W/T for Harbhajan puts him much higher than Kallis in bowling performance even though their bowling strike rates are very similar. Kallis and Harbhajan’s bowling average is 32.65 and 32.46. Based on the above suggested formula for calculating bowling score, Kallis’s bowling score is 72.04 (69.29/1.76 + 32.65) whereas Harbhajan’s score is 49.39 (68.54/4.05 + 32.46). Harbhajan’s ability to take wickets per Test is almost twice that of Kallis, and that is reflected in his better bowling score of 49.39 compared to Kallis’s bowling score of 72.04.
Total All-Rounder Composite Score = (Bowling Score / Batting Score) x 100
A higher batting average or batting score and a lower bowling score is better. Dividing the batting score by the bowling score is a very fair reflection for taking into consideration both the batting and bowling performance of an all-rounder. The reason for multiplying this factor by 100 is to bring the number in a more presentable range. Using this simple model and applying it to all those having 2000 runs and 200 wickets, the ranking of the 25 all-rounders is shown in Table 2.
Table 2: Ranking of all-rounders with 2000 runs and 200 wickets in Test cricket based on All-Rounder Composite Score
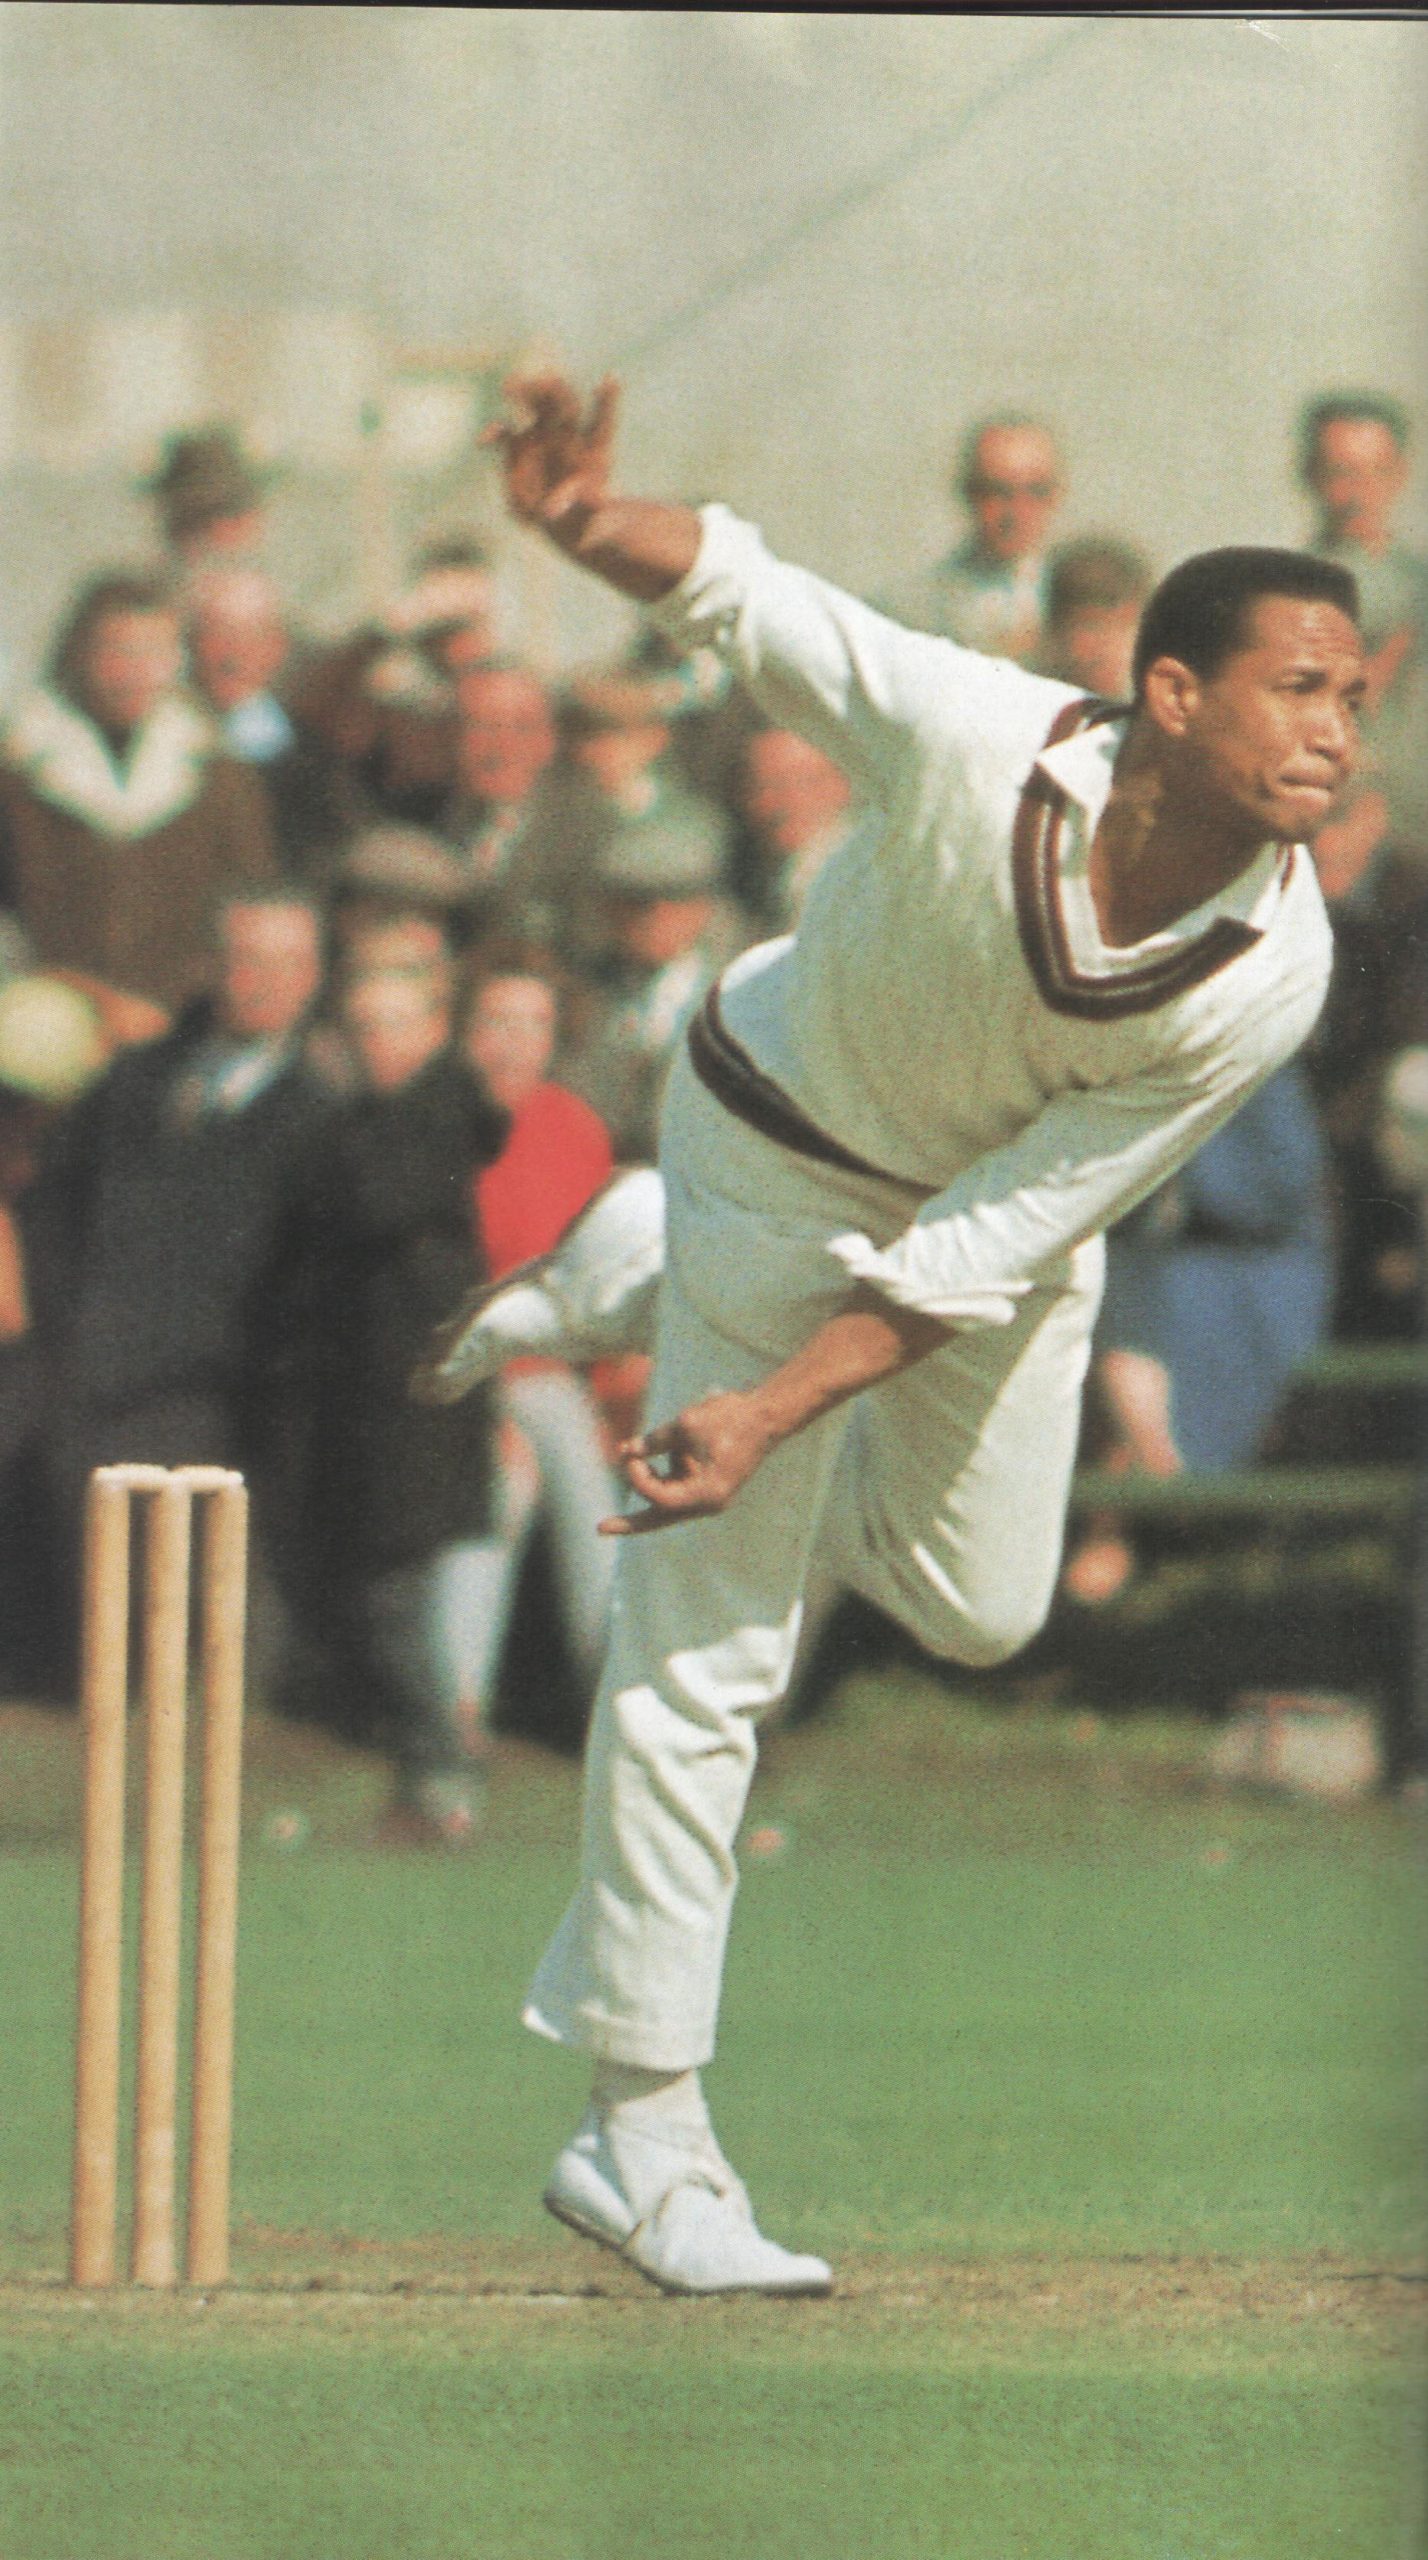
South African captain Shaun Pollock sends down another delivery as he demolishes the Australian top order taking 4-19 off nine overs in the final of the one day cricket event at the XVI Commonwealth Games in Kuala Lumpur 19 September 1998. Battling for the first ever cricketing gold medal at a Commonwealth Games, Australia scored 183 with captain Steve Waugh top scoring with 90 not out. (ELECTRONIC IMAGE) AFP PHOTO/William WEST / AFP / WILLIAM WEST
This approach gives a single all-rounder score that combines a player’s performance both in batting and bowling, taking into account not only the batting and bowling averages but also additional metrics such as bowling strike rate and wickets per Test. Sobers and Kallis are the only top-order recognized batsmen in this list and it’s not surprising these two have the highest batting point. Sobers with 57.7 and Kallis with 55.3 batting points are far ahead compared to the rest on this list. However, both were never front-line bowlers for their respective teams, their wickets per test is less than 2 and this justifiably translates into inferior bowling points for both. On the other hand, Richard Hadlee and Ashwin are the two bowlers on this list having wicket per test over 5.0 with very competitive bowling averages which puts them at the top for bowling points. This signifies the fairness of this balanced methodology considering all basic parameters.
The composite all-rounder points bring – without much surprise – Imran Khan, with 105.1 all-rounder points to the top of the ranking. Imran’s batting average of 37.69 is the fourth best on this list of selective players. His bowling average of 22.81 is second best on this list marginally below Hadlee’s bowling average of 22.30. These two factors put him very rightly as one of the greatest all-rounders in the history of Test cricket. Perhaps a more interesting name within the top five is Ravindra Jadeja occupying the number two spot with 93.9 all-rounder points far ahead of Botham and Kapil. Looking at his numbers, he enjoys better batting and bowling averages and has superior wickets per test than Kapil and Botham which fully justifies rating him higher than these two all-rounders of the 1980s.
On this list, quite a few players have more than 2000 runs but they were or are either lower-order batsmen or trail enders accumulating over 2000 runs primarily due to the large number of Test matches played. All such players have batting averages below 25 and shouldn’t be classified under the category of an all-rounder. These include MA Starc, MG Johnson, R Benaud, SK Warne, Harbhajan Singh, A Kumble, SCJ Broad, C Vaas, Wasim Akram and TG Southee. Removing these ten players brings the list down from 25 to 15 all-rounders for further in-depth qualification.
A few other parameters such as leadership qualities and fielding also warrant attention. The term all-rounder is a 360-degree term that encompasses not only cricketing skills but also takes into consideration leadership qualities. There have been many top quality leaders in test cricket history but only a few of them were genuine all-rounders. Ian Botham of England was one of the premier all-rounders during the 1980s. However, when he was appointed captain of England, he struggled significantly in the role and his performance declined. In contrast, when Imran Khan took the rein of the Pakistan cricket team, he turned out to be an astute leader able to inspire his team to great victories. His performance both with the bat and the ball had a profound impact on his team’s overall results.
On this list, 11 players were regular captains of their respective teams. Kallis is not considered here even though he led South Africa in two Tests during his long 166 Test career, but he was a make-shift captain in 2006 to replace Graeme Smith who was not available due to an injury.
Table 3: Top all-rounders who also captained their respective teams

Leadership points are calculated using a conventional success percentage method, where 2 points are awarded for each win and 1 point for each draw. For instance, Pollock’s success percentage of 67.3% translates to 67.3/5, resulting in 13.5 leadership points. The division of 5 ensures the scores are in a more presentable range and prevents leadership from overshadowing batting and bowling contributions.
Additionally, many players on this list were exceptional fielders and held over 100 catches and this has to be considered within the points-scoring mechanism. For fielding points, each catch gets 5 points, and all points are then divided over the total matches played. Sobers took 109 catches in 93 games, earning him 109 x 5 = 545 points, which is divided by 93 Tests, giving him 5.86 fielding points.
By incorporating these additional parameters and adding batting, bowling, fielding and leadership points to get total all-rounder points, the top 15 plus Richie Benaud and Wasim Akram (although they have batting averages of under 25, we consider them here as they both captained their respective sides regularly), the final list of the top all-rounder is as shown in table 4.
Table 4: Top all-rounders in Cricket history (batting, bowling, fielding and leadership)
This study shows Imran Khan stands out as one of the finest all-rounders in the history of Test cricket. Imran was not only a complete bowler and very reliable batsman but also a very inspirational leader securing Test victories against top teams on their home turf. In a 43 Test sequence between 1st Dec 1980 to 30th April 1988, Imran took 215 Test wickets at 17.42 which is the lowest bowling average any bowler has returned in a 40-plus test sequence in nearly 15+0 years history of Test cricket. During this period, he also scored 1749 runs at 38.86 winning Test matches in England, India and the West Indies.
However, like any other statistical ranking methodology, this one is not without its imperfections. Numerous other factors could be considered to make this analysis more intriguing. Comparing players from different eras has always been challenging and involves substantial subjective judgement. Regardless of the factors considered, while a few players might shift their positions on the list, the same core group of players will remain on the ranking list and will surely add complexity and spice to this debate.