In 11 editions of ICC Cricket World Cup, only 5 teams have managed to win that prestigious ICC event. World Cup 2019 will be the first time in the history where two full members of ICC will be forced to take part in a qualifying tournament. The possibility of one of the 5 former Champions ending up being one of those two full members has added a never-before thrill and curiosity in the Cricket world.
The hosts, England, and top 7 ranked ODI teams (excluding the hosts) will qualify directly for the main round while the others will compete with associate and affiliate members of ICC in a separate tournament, in 2018, to qualify for the World Cup in 2019. With all eyes set on figuring out which of the full members of ICC will miss out direct qualification in ICC Cricket World Cup 2019, ICC ODI rankings mechanism has come under focus like never before.
As of April 11, 2017, this is how the teams are stacked in ICC ODI Rankings:
| Rank | Team | Pts | Rank | Team | Pts | ||
| 1 | South Africa | 119 | 7 | Bangladesh | 92 | ||
| 2 | Australia | 118 | 8 | Pakistan | 90 | ||
| 3 | New Zealand | 113 | 9 | West Indies | 83 | ||
| 4 | India | 112 | 10 | Afghanistan | 52 | ||
| 5 | England | 108 | 11 | Zimbabwe | 48 | ||
| 6 | Sri Lanka | 98 | 12 | Ireland | 42 | ||
| Table 1: ICC ODI Rankings as of April 11, 2017 | |||||||
However, in the midst of all that excitement of possibilities, permutations of results of already announced matches and speculations of additional matches being organized before cut-off date, some fans have probably missed out an important piece of this World Cup 2019 Direct Qualification puzzle, that is, annual update of ICC ODI Rankings. The Current ICC ODI Rankings are subject to change as a result of annual update of ICC ODI Rankings. Hence, no calculations, permutations and speculations are meaningful without factoring in any ICC ODI Ranking annual update before the cut-off date for direct qualification for 2019 World Cup.
ICC ODI Rankings changes overnight once every year when ICC updates Ranking Points of each team to keep the Rankings current and accurate. Since the inception of ICC ODI Rankings in 2003, its annual update this year might turn out to be the most significant one ever. The update takes place on 1st May every year when the ICC ODI Rankings are adjusted according to these predefined rules:
- Any points earned earlier than the last 36 months (since 1 May of 3 years ago) are discarded
- Weightage of all points earned between the last 13 to 36 months (between the May of 3 years ago to April of previous year) is set to 50%
- All points earned during the last 12 months (from May of previous year to April of current year) continue to carry the weightage of 100%
Till 30 April of the next year, the above rules remain in effect. Till the next annual update, points earned by matches played during this period are simply added into the annually updated rankings as on 1st May to give the current ICC ODI Rankings. That means, on every 30 April of a year:
- Points earned during the previous 24 months (since the May of two years ago) are counted with 100% weightage.
- Points earned in between the previous 25th and 48th months (since the April of 2 years ago to May of 4 years ago) are counted with 50% weightage.
The same rules will be applied on May 1, 2017 and the updated calculation model will remain in effect till the cut-off date for 2019 World Cup direct qualification – September 30, 2017. This is how this year’s annual update will reflect on 2019 World Cup direct qualification:

Since, the 3rd ODI between Pakistan and West Indies was the last ODI scheduled between any of the two, out of the twelve, ICC ODI ranked teams during 2016/17 season, there will be no further changes to the current ICC ODI Rankings before the annual update and the post annual update standings can be calculated right away.
This is how the ICC ODI Rankings will look after this year’s annual update:
| Rank | Team | Pts | Rank | Team | Pts | ||
| 1 | South Africa | 123 | 7 | Bangladesh | 91 | ||
| 2 | Australia | 118 | 8 | Pakistan | 88 | ||
| 3 | India | 117 | 9 | West Indies | 79 | ||
| 4 | New Zealand | 115 | 10 | Afghanistan | 52 | ||
| 5 | England | 109 | 11 | Zimbabwe | 45 | ||
| 6 | Sri Lanka | 93 | 12 | Ireland | 43 | ||
| Table 2: Post May 1, 2017 rankings | |||||||
The idea of ICC ODI Rankings was to build a mechanism to quantify the success of different teams, benchmark their performance and identify the top, the average and the below par teams at certain point in time. The mechanism works on a combination of performance in a match and the current form of the competing teams.
The official ICC website describes the Rankings in these words:
“A team that, over the period being rated, wins as often as it loses while playing an average mix of strong and weak opponents will have a rating of close to 100. A rating of 100 could also correspond to a side that wins more often than it loses but who has generally played more matches against weak teams. Similarly, if the majority of its matches are against strong teams, then a rating of 100 could be achieved despite having more defeats than victories.
It is quite often the case that there are a number of teams in the 90-110 range. These teams are of broadly similar standard. A rating above 120 suggests consistently strong performances. Above 130 is rarely achieved and suggests a high degree of dominance over all other teams” Source: icc-cricket.com
For the purposes of quick referencing, ranking of 100 can be considered as par, 120 as excellent and 130 above as exceptional. This piece of information helps a lot in seeing a team’s ranking in the context of its own ranking points instead of judging its performance only on the basis of where it stands in the list of twelve ODI Ranked teams at any point.
Theoretically, a team can come out as the number one ranked team in the world with 110 ranking points as well but in the context of strength of performance, that number one ranked team may fall way behind a number one ranked team with 130 ranking points or even a number two or number three team with 120 points.
The other aspect of ICC ODI Rankings is the recent form of the teams. The idea there is to gage the consistency in performance of a team over a period of time and reduce the impact of occasional spike in the performance of any team. The rankings are designed to judge the teams during a reasonable period rather than on the basis of few good or bad series or matches. For that reason, ICC ODI Rankings includes the performances of last 3 to 4 years as detailed earlier.
On that note, it is also worth having a look at how different teams have performed during recent ICC ODI seasons as it also gives a fair idea of why and how some teams will benefit from the annual update and some teams will lose some points (and ranking position). Having a look at the points earned during specific seasons also indicates the trend of improvement or decline in the recent performance of teams. It clearly answers why certain teams enjoy a high ranking position even after performing badly in recent times whereas some teams are struggling in the lower half of the table even after performing better.
During the last 4 ICC ODI Rankings seasons (May 1 to April 30), this is how different teams have performed regardless of their performance in previous 3 to 4 years at that time :
| Points earned in specific seasons (excluding previous years) | |||||||
| # | Team | 2013-14 | # | Team | 2014-15 | ||
| 1 | Australia | 118 | 1 | Australia | 133 | ||
| 2 | Sri Lanka | 116 | 2 | India | 125 | ||
| 3 | New Zealand | 109 | 3 | New Zealand | 122 | ||
| 4 | India | 108 | 4 | South Africa | 115 | ||
| 5 | South Africa | 106 | 5 | Sri Lanka | 101 | ||
| 6 | England | 98 | 6 | Bangladesh | 91 | ||
| 7 | West Indies | 97 | 7 | England | 89 | ||
| 8 | Pakistan | 97 | 8 | West Indies | 88 | ||
| 9 | Zimbabwe | 68 | 9 | Pakistan | 74 | ||
| 10 | Bangladesh | 65 | 10 | Ireland | 54 | ||
| 11 | Ireland | 40 | 11 | Afghanistan | 42 | ||
| 12 | Afghanistan | 12 | Zimbabwe | 39 | |||
| # | Team | 2015-16 | # | Team | 2016-17 | ||
| 1 | Bangladesh | 122 | 1 | South Africa | 134 | ||
| 2 | Australia | 120 | 2 | India | 122 | ||
| 3 | England | 114 | 3 | England | 121 | ||
| 4 | South Africa | 112 | 4 | New Zealand | 112 | ||
| 5 | New Zealand | 110 | 5 | Australia | 111 | ||
| 6 | India | 99 | 6 | Pakistan | 98 | ||
| 7 | Sri Lanka | 95 | 7 | Sri Lanka | 85 | ||
| 8 | Pakistan | 86 | 8 | Bangladesh | 79 | ||
| 9 | Afghanistan | 57 | 9 | West Indies | 76 | ||
| 10 | West Indies | 54 | 10 | Afghanistan | 54 | ||
| 11 | Zimbabwe | 45 | 11 | Zimbabwe | 52 | ||
| 12 | Ireland | 34 | 12 | Ireland | 42 | ||
This summarized view opens up the opportunity to assess the performance of teams in isolation – ignoring their ranking and comparing their performance with their own performance in other seasons:
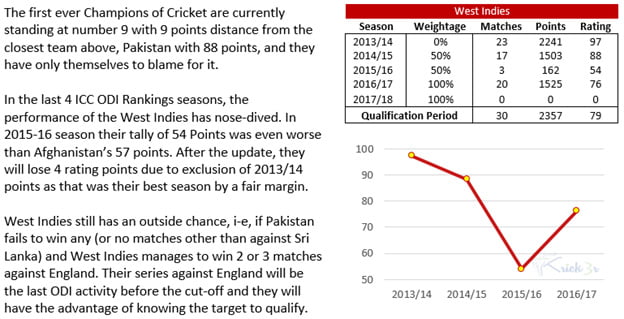
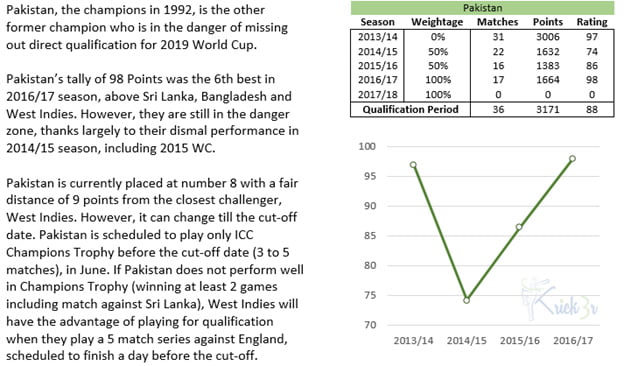
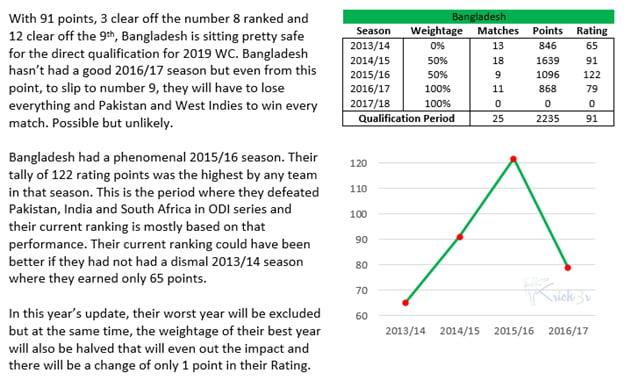
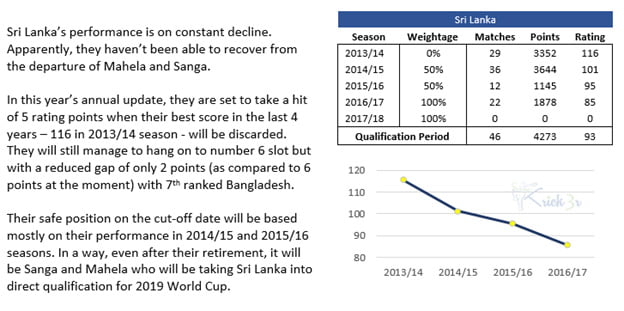
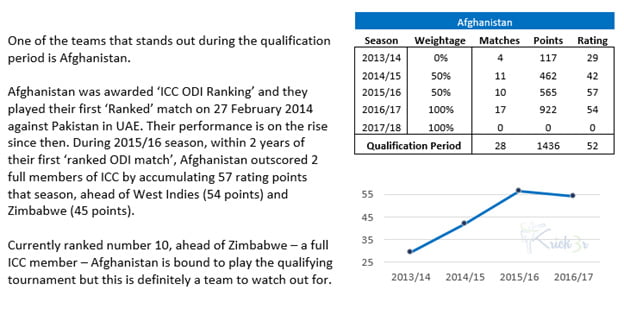
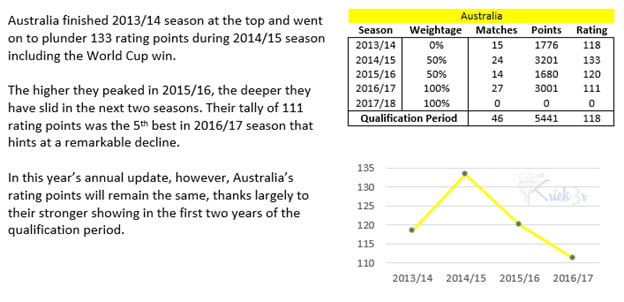
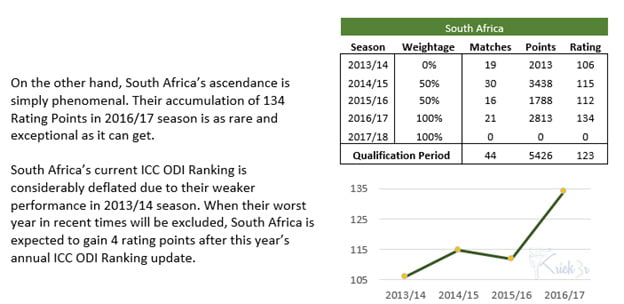
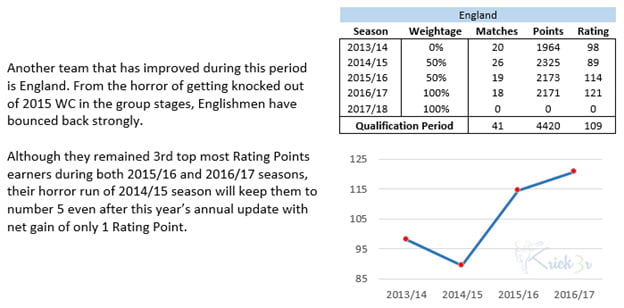
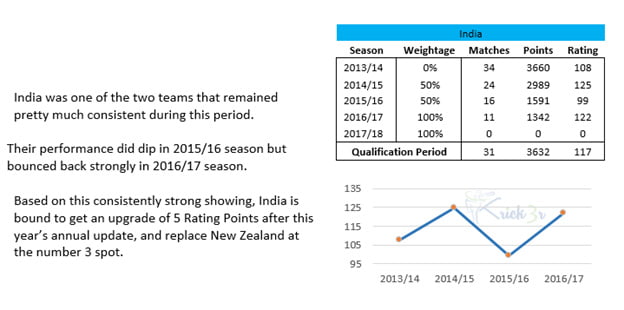
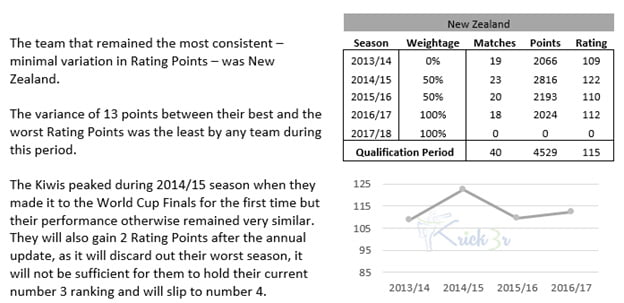
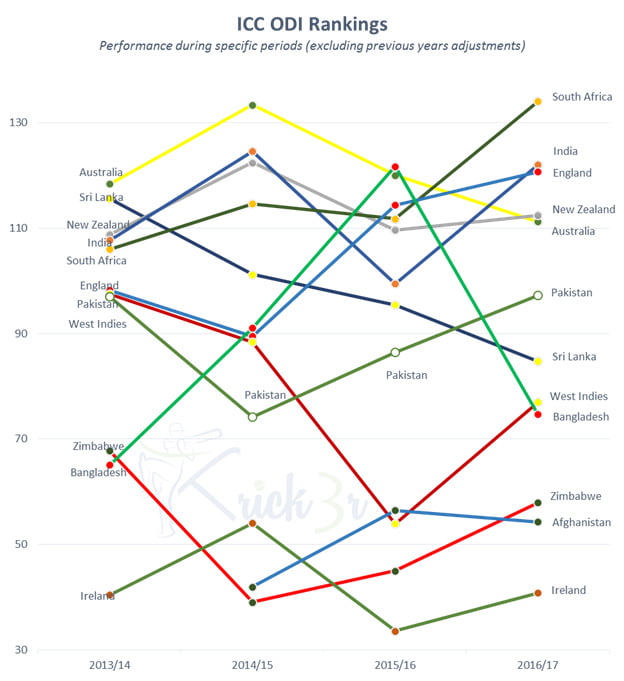
Finally, plotting the performance of all ICC ODI Ranked teams over the period of last 4 years provides a good quick reference to what has been happening in ICC ODI Rankings and which teams have been improving and declining during this period:
To conclude, the idea of two tiered ICC ODI World Cup looks good but it can be improved further.
The qualification tournament looks a nice idea, however, instead of hosting it a year earlier than the main round it would be better to organize this tournament months before the main round. It may also help in building the right momentum at the right pace for the success of an ICC World Cup.
In the current model, the cut-off date is set to be almost 2 years before the World Cup. That means the Qualification Period spans from 2 to 5 years earlier than the World Cup. The previous world cup also falls in this period. On one hand, it provides a lot of context to the performance of teams in the previous World Cup and 2 years right after that. But, on the other hand, it greatly reduces the context of the Cricket played in 2 years right before the World Cup.
For instance, the Cricket played between September 30, 2017 and May 1, 2018 will hold no value in the direct qualification for either 2019 or 2023 World Cups. If the Qualifying Tournament also falls within this window, it will further reduce the chances of full members in the bottom half of the table to improve their rankings. The teams will benefit or suffer greatly from the performance in the previous World Cup that may yield, apparently, unfair dis/advantage to some teams.
It will be better if the cut-off date for direct qualification round is shifted to a year before the main round, instead of two years earlier. It will reduce the impact of performance of the teams in the previous World Cup and it will provide more time to the bottom teams to improve their rankings – 3 years instead of 2 years window that will also add more context to the ODIs played in between the two ICC World Cups.
DISCLAIMER: No data except for the current ICC ODI Rankings holds any official status. The rest of the data is gathered through public information and processed by the writer that is subject to minor deviation from the official stats. The compilation is for trends analysis purposes only. The official numbers may vary slightly but the overall trend analysis is expected to remain the same.
The writer blogswith the pen-name of ‘krick3r’ and can be contacted directlyatfb.com/krick3r and twitter.com/krick3r for any direct feedback and discussions.
